
Shopify Product Research Strategy For Beginners
Ben Kissi / 11-03-2020
In 2017, global ecommerce sales reached $2.305 trillion which is a 24.8% increase as compared to the previous year. The ecommerce industry is growing rapidly with a 10.2% revenue share of the global retail sales (eMarketer). Ecommerce sales is estimated to reach 11.6% of global retail revenue in 2018 (statista). Despite the amazing growth of the ecommerce industry, getting started as a new ecommerce entrepreneur can be difficult. This guide will cover one of the major challenges every new ecommerce entrepreneur faces; finding the right product to sell. We are going to address this problem through data driven product research.
Ecommerce product research is vital in starting your online business and every ecommerce entrepreneur should be intentional about it. Being intentional about your product research means, following a methodology that allows you to identify opportunities and potential for growth through data analysis.
What defines a good product?
As a new ecommerce entrepreneur you must be picky when it comes to the kind of products you start out with. Below are the characteristics of a good product and these should provide a fair idea about the kind of products to look out for.
- The product price should at least be between $10 - $100. If the price is below $10 then there will potentially be profitability issues and you don’t want something too expensive which will require a lot of money to get started.
- The product should be lightweight, durable and easily shippable. Avoid fragile products when you are starting out.
- Find products that can easily give you at least 2X (2 times) your cost. Your target should be at least a 50% margin. The sweet spot is a 67% margin or 3X your cost.
- The product should be readily sourceable. You should be able to easily find suppliers for the product. Alibaba and Aliexpress are a great place to start looking for your initial suppliers.
- Must have a wow factor; there must be something unique, peculiar, funny, viral etc about the product.
We cannot identify what makes a good product without identifying what makes a product bad.
- Avoid products that are heavy, bulky, fragile and difficult to ship. Products that might have issues at the customs should be avoided.
- Products that require high technical know how with a lot of moving parts should be avoided when starting out.
- Products that are in markets of high brand loyalty are typically difficult to sell. Products such as baby diapers and Q-tips are a few examples. Imagine how difficult it will be to convince a mum to purchase your baby diapers.
- Avoid trademarked goods and highly regulated products.
Now that you know what makes a good and a bad product, let’s now begin the real work. The product research methodology described here is broken into two parts, namely: product prospecting and product viability analysis. The first focuses on getting product ideas, identifying trends and market demand. The second part focuses on business viability of the product.
Product Prospecting
Product prospecting is basically trying to find product ideas and identifying market demand for those products. Trying to magically think of a winning product by yourself can be difficult and most often a waste of time. To get product ideas, simply look out there, go to competitor stores within a particular niche and find what their best selling products are. I know you will be asking “How do I do that?” it’s quite simple, just read on to find out.
For the purpose of illustration, I will be looking at 1 niche and I will prospect 1 product. Now go to Google and search for “Top ecommerce niches and product categories”, go through the first 5 post to give you some product category ideas. Below are my top 10 picks:
- Dog accessories
- Facial beauty
- Men’s Grooming
- Baby products
- Craft supplies
- Vapors (Electronic Cigarettes)
- Smart backpacks
- Cool socks
- Phone accessories
- Kitchen supplies
I created a Google spreadsheet that will help you identify your winning product(s) by simply filling in some data. Here is a link to the sheet, make a copy inside your Google drive in order to edit it. Now the next thing to do is to fire up Google trends and identify the popularity of these product categories.
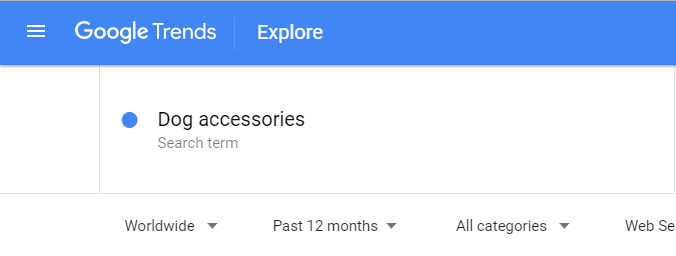
Step 1 In Google trends type in “Dog accessories” or your preferred product category and select your target country, set your time period to the past 12 months. Select your target location, I used worldwide as my target location. The next thing is to input its corresponding data in the sheet.
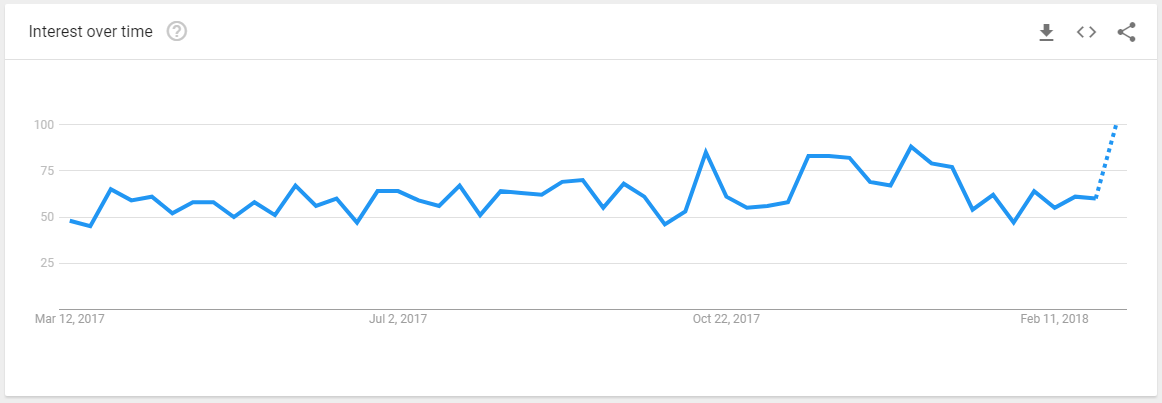
Input the current score or the score before the dashed end of the line. At the time of writing this post my current value was 60. Input the score for the previous 12th month (ie. the value at the beginning of the graph from the left), in my case this value is 42. Lastly, count 4 points back from the current point and record that score in the “previous 4th score” column.
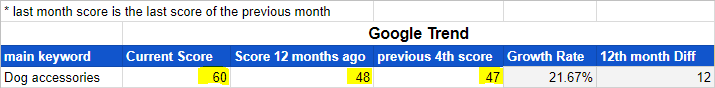
The “growth rate” and the “12th month difference” will automatically be calculated. The “growth rate” is the percentage increase between the previous 4th score and the current score of the current month. The “12th month difference” is the difference between the current and the last scores.
Step 2 For the next step, we will need a social media monitoring tool. The tool I used in this example is called Brand24. There are several social media monitoring tools but I prefer Brand24 because of how they represent the data and how easy it is to use. Brand24 offers a 14-day trial so you can test it out. Add a new project and type in your keyword.
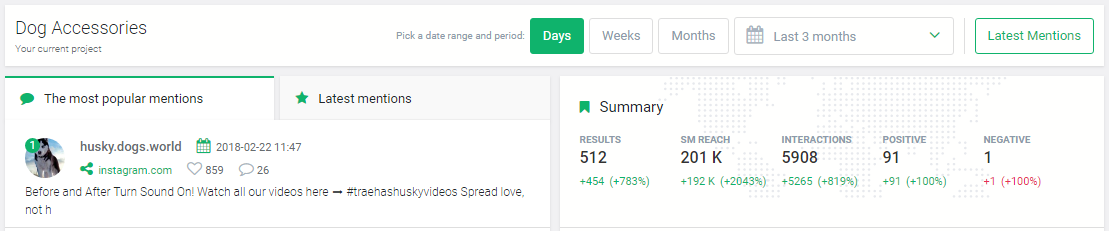
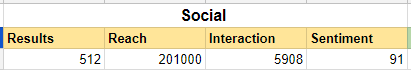
Select ‘last 3 months’ as your time period, this will give you data on the keyword for the last 3 months. Dog accessories returned ‘512’ results with ‘201,000’ social media reach. It has ‘5,908’ interactions which shows a high level of engagement. It has a high positive sentiment score of ‘91’ which means people love the topic.
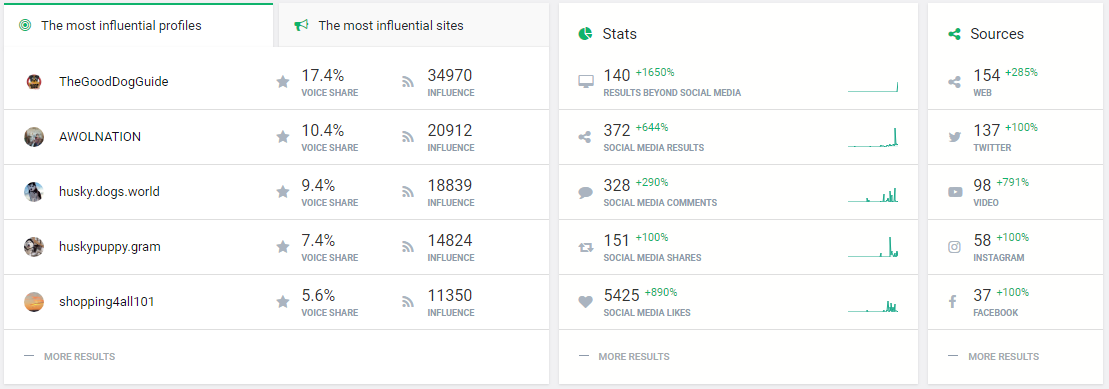
Brand24 also gives you information about where the conversation is happening. It breaks the data into social channels and also tells you the most influential profiles and sites. This information comes in handy when you want to identify the most influential sources to build backlinks for your SEO.
Record the results, the reach, interaction and the sentiment score in the sheet.
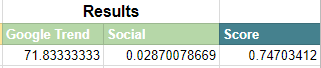
The Results column should automatically be computed, if it does not, pull down the formula from the top cell to the next cell. A good product category is one with a score equal to or greater than 0.7.
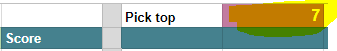
After inputting the data for all the product categories, scroll to the right and select your top pick by putting in the number of categories you want.
Step 3
The next step is to get specific product ideas for your top product categories. We can do that by finding out the best sellers of existing stores. To do that, go to Google and search “.myshopify.com + niche” this will show you Shopify stores that sell products within your target niche. The first page that turned up after searching “.myshopify.com + dog accessories” was Silver Foot.
Visit the top five websites and find their best selling products. Simply add this url parameter /collections/all?sort_by=best-selling to the end of their URL. Silver Foot’s URL looks like this after adding the url parameter:
https://silverfoot.myshopify.com/collections/all?sort_by=best-selling. Doing this will show you a store’s best selling products.
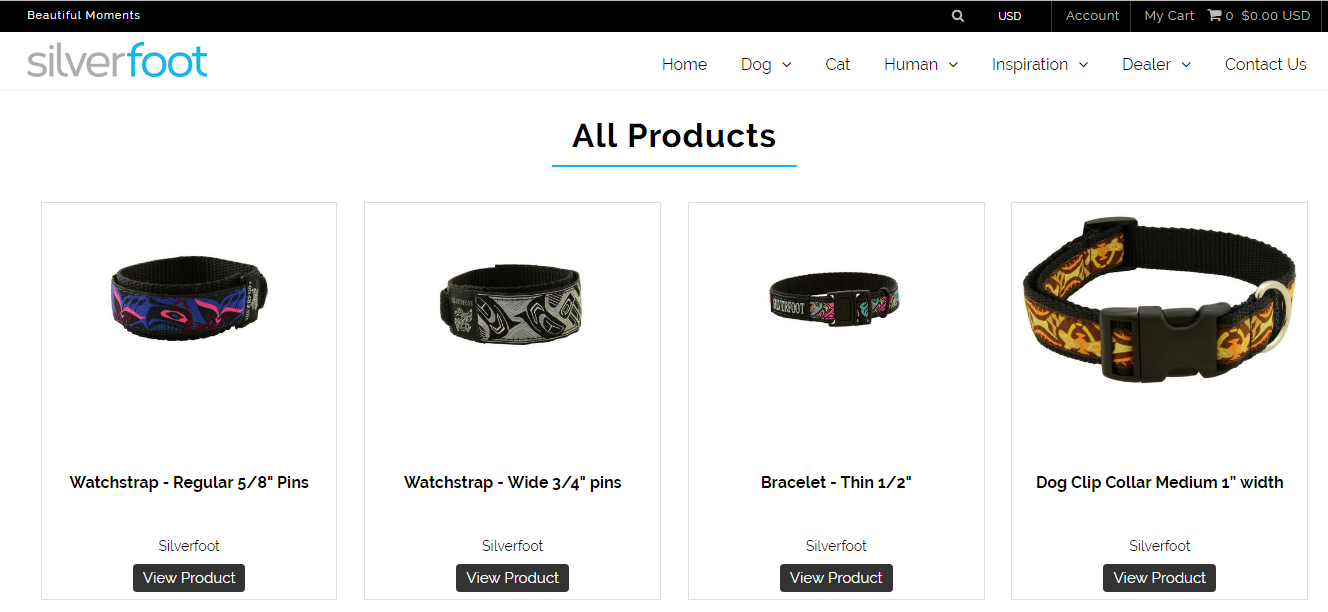
It seems SilverFoot does not sell only dog accessories, but their top best seller for dog accessories is Dog Clip Collars. This product shows up a couple of times on the first page.
You can also use MYIP.MS and search under hosting/IP information of websites owned by Shopify Inc. You can click on this link to find Shopify stores ranked by popularity on MYIP.MS. Find stores that fall within your target niche and investigate their best selling products using the method above.
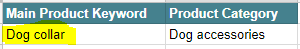
Select a product for each product category and record the main keyword for each product in the sample sheet section in the spreadsheet. In choosing your products, make sure each product meets the requirements for a good product as described at the beginning of this guide.
This brings us to the end of the product prospecting section. The next section will take you through how to analyse the business viability of a product.
Viability Analysis
After gathering prospective products for each product category, it’s now time to find the best product(s) to sell.
We will be using two platforms to validate the viability of products. I know you might have guessed them already. These platforms are Amazon & Aliexpress. These platforms have become popular in the ecommerce industry and receive a lot of purchases annually, which means they gather a lot of data about products. To mine this data, you will need the help of tools.
We will call on two tools to the rescue, Unicorn Smasher for amazon and Alitools for Aliexpress. They are both Chrome extensions and work through the Google chrome browser. Follow the links to install them.
After installing them, follow the steps below to analyse the viability of your prospected products.
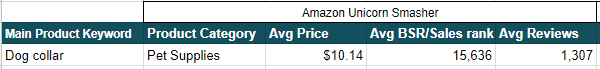
Step 1 Go to Amazon and search for your product keyword (Dog Collar) and click on the Unicorn Smasher icon at the top section of your browser.
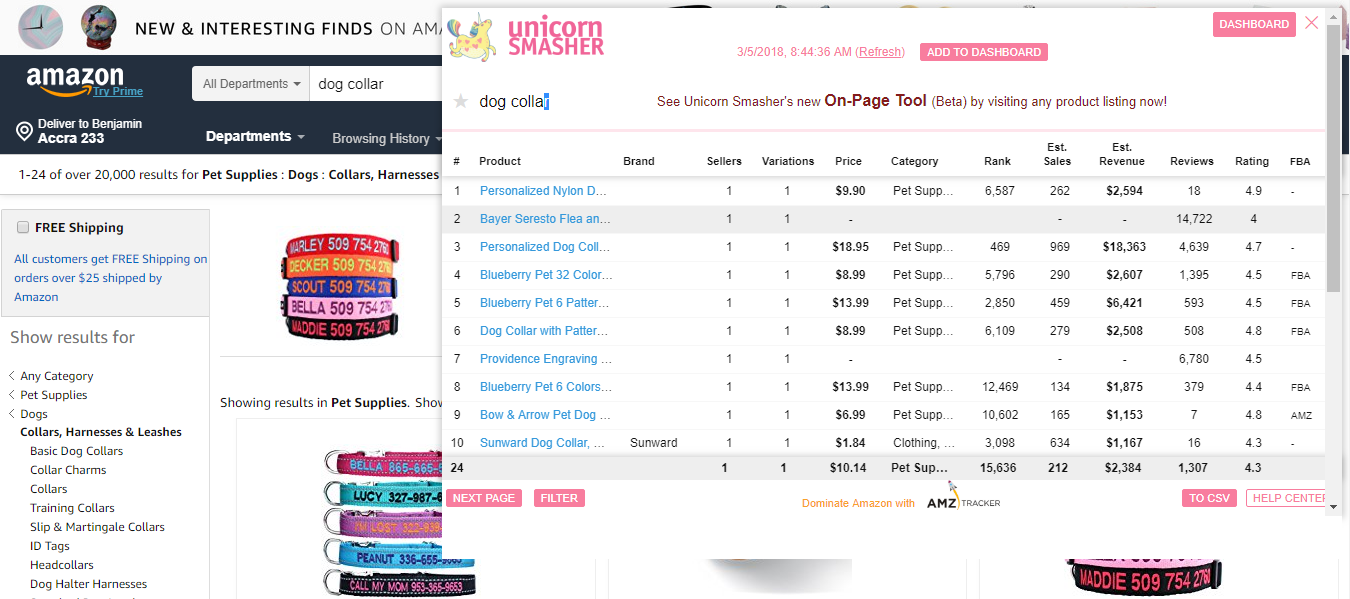
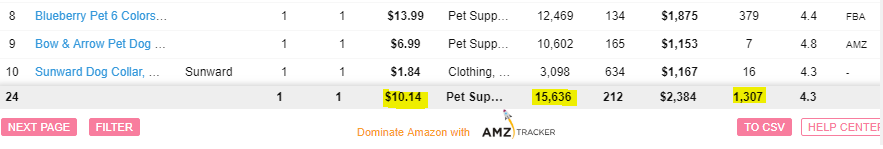
Unicorn Smasher will pull in data about all the products on the first page and compute their averages below the table. Record the product category, average price, average best seller rank (BSR), and average reviews. Record these values in the viability analysis sheet. Make sure the average cost of the product is between $10 - $100.
Step 2
On Amazon, we made sure our prospective product was between $10 - $90. The average price on Amazon for a dog collar is $10.14. On Aliexpress, we will have to find a similar product that sells at a cheaper price and resell it at the same price as or close to the average selling price on Amazon.
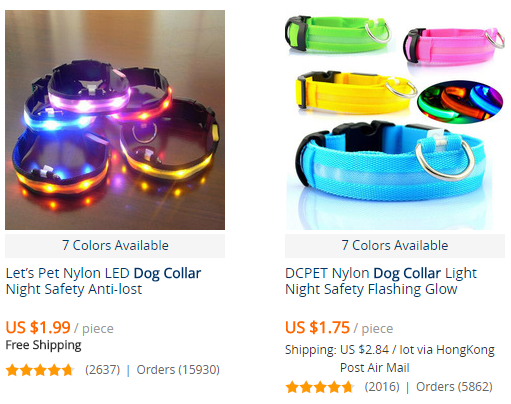
Make sure to find something similar but better than your competitors’ best seller product. Go to Aliexpress and search for the product keyword (Dog Collar). On Aliexpress, sort the results in order of number of sales/orders.

Go through the first page and find a product that you can sell at the average price on Amazon. Also, look for sellers that provide something extra, like customizations or freebies. The first two products were LED dog collars which obviously has a ‘wow factor’.
Visit the product page of both products and click on the Alitools icon ( one of the chrome extensions you installed, remember?). This will pop up a floating tool at the lower left corner.
Click on the seller rating icon. This will show you information about buyer sentiments.

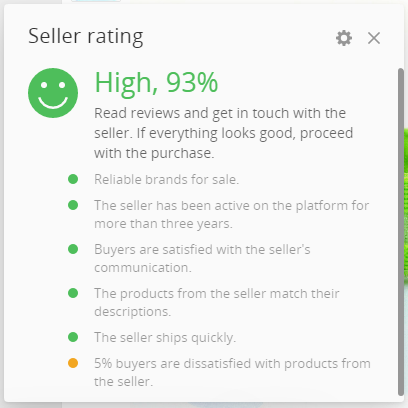
Comparing the user sentiments, it can be seen that the first product has a lesser seller rating of 89% as compared to 93% of the second product. The seller of the first product has not been active on Aliexpress for more than a year. For the first seller, 6% of buyers are dissatisfied with products from the seller while 5% are dissatisfied with the products for the second one.
Now the numbers make it pretty obvious which seller to go with. Although the first product has way more orders, it is safer to go with the second seller with a lower price.
Step 3
Record the price, number of orders, number of reviews and sentiment score in the viability analysis sheet under Aliexpress.
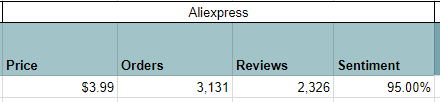
After inputting all the required data into the sheet, the results will be computed automatically.
The estimated selling price is computed with a 5% reduction on the average selling price on Amazon. This is just to give your product a competitive price but you can decide to sell at the same price as on Amazon. The estimated profit is based on the cost price on Aliexpress and the estimated selling price.
Repeat this process for each product until you exhaust every category. The score is computed and used to rank the various products. On the right side of the table, you can select your top products by typing the number of top products you want.
After deciding on your products, the next thing to do is to add them to your store. Manually adding products from Aliexpress to your Shopify store can be cumbersome and tedious and you shouldn’t waste your time doing that. This is why apps were created. Thank God for apps!
You can use several dropshipping apps to easily add products from Aliexpress and other sources. One Shopify app you can use for dropshipping from Aliexpress is Orberlo. They have a free package and it is a good app to get started with.
Moving Forward
Finding the right product should not be a guessing game anymore. The method described here is a comparison process which will help you to determine the best product to choose within a group.
Do your due diligence by analysing more data from different sources like Wish.com and Ebay.com. After adding your products to your store and setting up your product pages, the next step is to optimize your store and product pages for SEO.
If you love automation like me and will like to automate your interest research for your Facebook ads, then try out Getch
Happy Selling!